Ichimoku Cloud or Ichimoku Kinko Hyo is a leading trading indicator developed by a Japanese named Goichi Hosoda.
The uniqueness of this trading indicator is that it consists of several elements that allow it to work as an individual trading strategy.
If you use this trading indicator, you can make the right amount of money without any help from other indicators.
In the following section, we will see the details about this indicator along with a trading strategy.
There are several trading strategies of this indicator. We will do one of the best forex strategies among them.
Elements of Ichimoku Cloud
Ichimoku cloud is a messy indicator with a lot of elements that often confuse traders.
However, if you understand the ingredients well, you can make a good profit from it.
Let has a look at the elements of Ichimoku Indicators:
- Senkou Span A- it is marked as a red line, which represents the average value of the last nine candles. However, the calculator of the average price is different from the traditional moving average.
- Senkou Span B- it uses the same concept of Senkou Span A. However, it uses 26 periods of average price instead of 9. Generally, this element is represented as a blue line.
- Chikou Span- Chikoe Span is shown as a green line and indicates the current price but 26 periods earlier. Therefore, it is considered as a lagging element of this indicator.
- Kumo Cloud- Kumo cloud is a zone or area that is covered with two different lines, that works at dynamic levels like Senou A and B.

The Senkou Span A is a fast cloud that is created from the average price of the last 26 candles.
On the other hand, Senkou span B is the lowest cloud that is used by 52 periods.
Therefore, Senkou Span B is slower than the Senkou Span A that shows results later.
Ichimoku Cloud Trading Strategy
Ichimoku cloud is a trading indicator that considers all the trading instruments to predict the price without any help from other indicators.
Furthermore, you can use this trading indicator to create an individual trading strategy, or you can add it with your existing trading strategy to increase the probability.
In this section, we will see a trading strategy based on the Ichimoku Cloud only and without any help from other trading indicators.
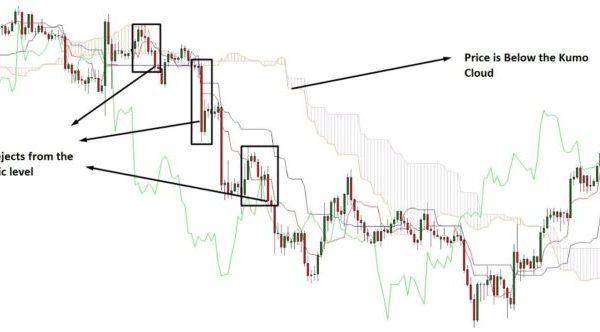
- Market Direction- We can predict the market direction by watching the price and comparing it with the Kumo Cloud. If the price moves below the Kumo cloud, the price will be likely willing to move further down. On the other hand, if the price moves above the Kumo cloud, the price will probably move further high.
- After identifying the directions, we have to identify the possible trading entry. To determine the trading entry we can observe the dynamic level of Tenkan Sen and Kijun Sen. If the price stays above these levels and moves to the Tenkan Sen or Kijun Sen Line with a corrective speed you will see for that trading opportunity. We will enter the market as soon as the price resists the level with at least one candle close.
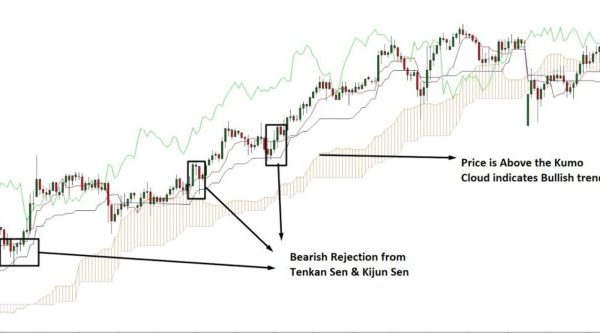
The image above represents how the price rejected from the dynamic Tenkan Sen and Kijun Sen line and moved to the upside.
In this market context, the price above the Kumo cloud, which indicates that the overall trend is bullish.
See the image below the same trading opportunity in the bearish market structure:
- If the price is above the Kumo Cloud, it is an indication that there is a strong bullish intervention in the market. Therefore, we will hold the price as soon as the price is above the cloud. Thus, the stop loss would be below the cloud or below the rejection candle. As we know, the financial market consists of several risks. We should add 10 to 15 pips buffer to avoid unexpected market volatility like we usually do with the moving average trading strategy. We will hold the price if it creates a new high and starts to move higher by creating a new high or new low. Furthermore, we can use oscillators like MACD or relative strength index to identify the possible overbought or oversold zone.
- Another way to identify the possible closing level of the market is the divergence between the relative strength index and the price. If the price moves higher and lower, we can determine the impulsive pressure and see the price to move above the 70 levels or below the 30 levels of RSI; we can consider that the price reaches the oversold or overbought zone.

The image above represents the divergence between the price and the Oscillator.
- Furthermore, the price may show some divergence with the oscillator, and that will indicate as closing time.
Trade Management of Ichimoku Cloud Strategy
As we know, the potential market consists of volatility and uncertainty.
Therefore we need to minimize the risk to avoid any uncertain market condition.
At first, you should not invest money that we are not willing to lose.
It is recommended to use not more than 2% of your capital in one Trent.
If you use an excess of the recommended risk, you may panic when you see the price move against your Direction.
Therefore, it will lead you to make wrong decisions by closing the trade early or adding more positions in a losing trade, which is a bad practice.
Summary
If we summarise the whole concept of Ichimoku Kinko Hyo, we can find the essential element as below-
- Kumo Cloud is the principal trend identifier.
- We will follow the trail only towards the chain by measuring the position of the prize with her Kumo cloud.
- We will enter the trade when the price Dynamics with at least one candle close.
- We will close the position as soon as the oscillator most of our or our soul jam.
Furthermore, we can use the Ichimoku cloud trading strategy with other reading strategies like support and resistance, price action, Bollinger band, or moving average.
Trade management is an essential part of every strategy.
To avoid level circumstances, we can minimize the risk as low as possible.
Explore 21 Advanced Forex Trading Strategies
Recent Trade Idea You May Follow
Share on facebook
Share on twitter
Share on linkedin


