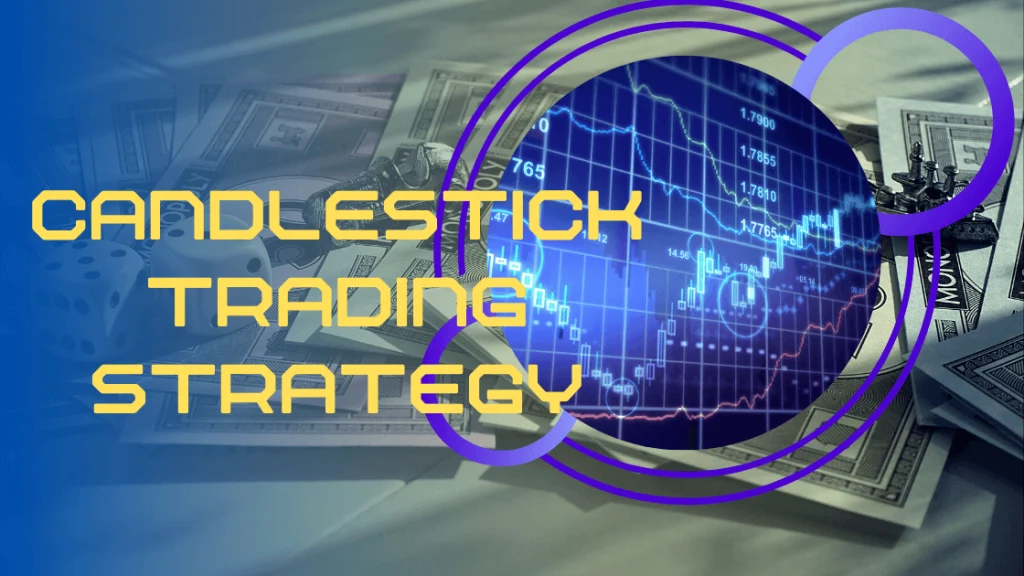
Candlestick is the most used trading tool by professional and institutional traders. The candlestick was introduced in Japan. Later on, people started to use this pattern in Forex trading.
After the introduction of Candlestick in Forex trading, traders started using Candlestick charts which introduced a new sector in technical analysis.
There are a lot of ways to use candlestick as a trading tool. You can choose the candlestick chart and use it as an individual Forex trading strategy. Moreover, you can mix it with price action and other trading methods to increase your probability.
The candlestick trading strategy without other indicators is also profitable, and many traders use it to make a considerable gain. In the following section, we will show we can use the candlestick strategy to make a good profit from the market.
We will identify the market trend using the Candlestick information and will enter the trade within the trend or against the trend based on the appropriate Candlestick pattern.
Identify The Market Trend
There is no specific way to identify the market trend, but we can predict what the upcoming market could be based on the candlestick pattern for a single candlestick formation.
As you know, there are different types of candlesticks, and each candlestick shows a story. If you can read this story, we can easily predict the Market Trend.
Mostly used candlesticks to measure the trend are mentioned below:-
Pinbar

This candlestick has a long wick than its body. It represents a market condition that was started with momentum and eliminated by the opposite party.
In a daily chart if we see a bullish trend to pick the price up to and at the end of the day the failure to continue the Momentum and fallback.
Therefore, we can predict that in the coming days, the fall of the price will continue.
Inside bar

It is a candlestick pattern that is not higher than the previous candle. High and low of this candle cannot break the high and low of the last day’s candle.
As a result, it is an indication that the price is likely to continue in the direction that was set yesterday.
Engulfing bar

This candlestick appears when a candlestick breaks the high and low of the previous candlestick. If it appears in a bullish market condition after a bullish daily close and on the next day the market opened and managed to stay within the previous day’s candle.
Therefore, it is an indication that the price is likely to move in the direction that was set yesterday.
Two bar

It is another candlestick pattern that shows market reversal. For example, if a market moved higher and reached a certain level and on the next day price moves back from the opening price and closes below the opening of the previous day’s candle.
It indicates that the price will reverse from where it started to move up. It is a clear indication of a price reversal that we may see.
Entry

In the above section, we have discovered how we can identify the potential market Trend. We must follow the trend from the minor pullback with an appropriate candlestick to measure the small pullback.
We can use several tools like the dynamic level of 20 Ema, or even after levels of minor support and resistance level; we will see the reversal zone. If a minor pullback appears toward the previous day’s price action, we will enter the trade as soon as the candle closes.
Stop Loss Level
In this trading strategy, the stop loss would be above or below the candlestick with at least a 10-15 pips buffer. Furthermore, you can add a price action context to use near-term support and resistance levels to identify the possible stop-loss levels.
Take Profit Level

You can consider the support and resistance level as a potential take-profit zone. Furthermore, you can add momentum by determining the speed of movement.
If the price moved towards your desired direction with massive speed, you could extend the take profit level until you find any rejection candle.
On the other hand, a corrective movement after entering a trade will indicate that the price may reverse at any time. Therefore, you should book some profit by watching the market.
Trade Management
Trade management is the hardest part that most traders fail to implement in their trading strategy. You must read the price carefully and minimize the risks as soon as the price started to move by breaking a new high or low.
If the price moves above the near-term high and low, you can put your stop loss at break-even to make the trade risk free. Later on, you can move your stop-loss depending on the market movement until you see any unusual market volatility.
So in trade management, please follow the rules that are written below:
- Move your stop loss at break-even when the price creates a new high or low.
- Extend the take profit level if the market moves with impulsive pressure.
- Take some parts of the price that reaches any potential reversal zone and show weakness.
Summary
After the above discussion, we can summarize the candlestick trading strategy as below:-
Use appropriate candlestick patterns to predict the market and identify the market trend.
Move to the lower timeframe and seek for candlestick patterns after a corrective reversal.
Later on use, candlestick reversal formation to identify the potential trading opportunity.
Put your stop loss as taking profit based on the market context and levels.
Furthermore, you can minimize the risk by using an appropriate lot size. On the other hand, strong money management skill is also essential as the Forex market is associated with some unavoidable risks.
Recent Trade Idea You May Follow
Share on Facebook
Share on Twitter
Share on linkedin


