
This week will start with some important releases where the Reserve Bank of Australia will deliberate how the COVID and lockdown affected the lower employment. During the proclamation of FOMC the investors may face some volatility. However, investors may find where the US Dollar is heading.
Let’s see what we have got for the coming week from the EURUSD:
EUR/USD
The key resistance level of equal high at 1.1900 shows curiosity if the buyers are still dominating the price or not of EUR/USD. The past week kicked off with a corrective momentum but on thursday the daily candle closed below dynamic 20 EMA. Afterward, another bearish momentum was seen as the US retail sales striked it. But at the end of the week there was a new bearish swing low.

In the image above, we can see that price closes below the dynamic level for the two following days. Therefore, the price may come lower in the forthcoming days if the bears can hold the price below the 20 EMA on the daily chart.
In the price setting, there is a possibility of bullish correction at the beginning of the week. But a new swing low below the 1.1711 may change pricing scenarios and take the price even lower about the 1.1640 level.
Contrastingly, any strong bullish movement above the dynamic 20 EMA may take the price higher from the 1.1900 area and change the current market structure.
GBP/USD
The previous week was volatile for GBP/USD as there was a false price break down from the 1.3900 psychological level and the week ended below the dynamic 20 EMA with a bearish movement. However, the bearish movement wasn’t strong enough below the 1.3729 support level to depend on the forthcoming bearish movement.

There is an impulsive compulsion at the beginning of 2021’s second half as the GBP/USD bulls are still active from 1.3634 to 1.3570 demand zone. Therefore, the possibility of bullish movement is still on until the bears swing low is 1.3570. In this situation, the market may reverse with the current bearish structure and take the price above the 1.3900 level if there is any buy sign from 1.3677 and 13600 level above the dynamic 20 EMA with a bullish daily close.
XAU/USD
On thursday, the bearish daily close of XAU/USD was stupendous but by the end of the week the support level was below the 1762.00, which makes the bearish possibility a little weak. There’s a possibility of a bullish movement and it may increase as the 90% of the bearish candle’s body is above the 1762.00 support level.

BTC/USD
The price of BTC/USD couldn’t break below the 42500 key support level with a bearish daily, which might put an end to the drama that was going on. Besides, the bullish movement held the price above the 47000.00 event level for three trading days. There’s a possibility of an
impulsive bullish pressure respecting the 60,000 level as there’s a new swing high above the 49,000 level.
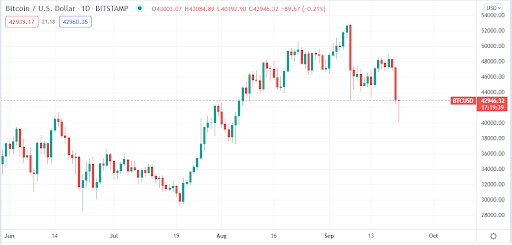
In the picture above, MACD shows a forthcoming bullish pressure. However, the bearish pressure downsized the price from the 51800.00 level to 47,000.00 level, which is a warning sign to the investors.
Overall, there is a possibility of a decent price movement for both bulls and bears.
Technical Analysis You May Follow
Share on facebook
Share on twitter
Share on linkedin


