
Whether you trade in the Forex market or the stock market, you have probably heard the name of pattern trading. When price moves, it creates specific patterns that allow traders to identify the next possible movement.
These patterns are known as harmonic patterns. Professional and institutional traders use this pattern to determine the next Movement in Forex, stock market, indices, metals, and cryptocurrency market.
In the next section, we will see what the harmonic pattern is in the forex market and how you can make your trade one step by using these tools besides forex trading methods.
What is the Harmonic Pattern?
Harmonic patterns are the combination of prices in the financial market that combines the cost and several Fibonacci levels.
As we know, it is imperative and seen everywhere in the world or outside the world and even in the financial market; therefore, the use of this essential element allowed us to examine the market very effectively.
There are two types of harmonic patterns in the market that are known as external and internal patterns. All of these patterns have the same significance and show the same level of market direction. When the market moves in a particular direction, each form of this pattern indicates that the reversal is coming.
Therefore if you can spot this pattern after a trending environment, you get a possible trade idea with a substantial risk versus reward.
Among the harmonic patterns, the butterfly is very important. In the next section, we will see what the butterfly harmonic pattern is and how you can implement it in your trading.
Butterfly Harmonic Pattern
The butterfly pattern is a reversal pattern that is mostly used for counter-trend movement. As a reversal pattern, we usually find it after a long-term bullish or bearish trend.
As we know, market reversal does not happen without a consolidation in the price. The butterfly pattern is usually the consolidation phase of the price, but it indicates stories and a mathematical form that is very important to understand.
In the image below we will see how a butterfly pattern looks like-
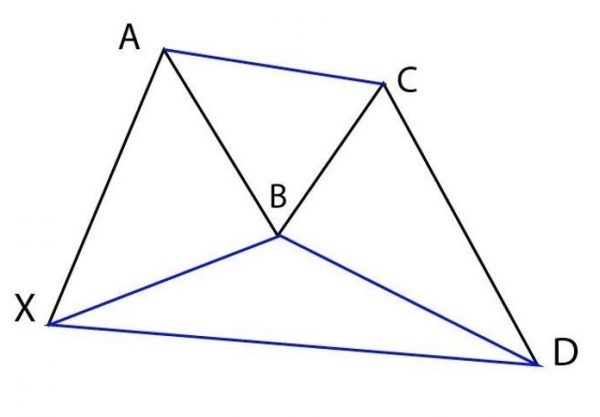
The image above represents a bullish butterfly pattern, which is usually seen after the long-term trend. In the picture, several legs started from XA, AB, BC, and CD.
X is the starting point of the pattern, and D is the entry point. this pattern will be valid if it completes the hole formation from X to D.
Besides this formation, the position of 20 points should be based on Fibonacci calculation as mentioned below:
- XA: It is the first leg. The bullish market scenario will appear after a bearish, and in a bearish market, it will look after the bullish trend.
- AB is the 0.786 or 78.6% retracement level XA.
- BC is 38.2% or 88.6% Fibonacci retracement of AB.
- CD is 161.8% – 261.8% higher than BC.
Gartley Harmonic Pattern
There are three types of forex markets:
H.M Gartley created Gartley during the era of R.N Elliot and WD Gann. In his book, Gartley considers the pattern as a pattern best trading opportunity.

This pattern seems like the M or Within the chart. Like the butterfly pattern also starts from the leg XA, AB, BC, and CD. Five points are essential in the Gartley pattern.
These points are X, A, B, C, and D. live butterfly patterns; this pattern also uses Fibonacci levels to identify these points.
The image above represents how a Gartley harmonic pattern looks like. in the next section, we will say how we can draw the harmonic pattern based on the calculation of Fibonacci:
- XA: It is the first leg. In the bullish market scenario, it will appear after a bearish, and in a bearish market, it will appear after the bullish trend.
- AB is the 61.8% retracement level XA.
- BC is 38.2% or 88.6% Fibonacci retracement of AB.
- CD is 127.2% extension of BC.
In the Gartley harmonic pattern, Fibonacci levels are significant. However, it is challenging to identify the exact Fibonacci levels as the price of a chart is not accurate for every broker. considering these a Gartley pattern will be like the below:
- Leg AB should be similar to leg CD
- Point B must retrace 78.6% of XA leg
- The point D must be 127% or 161.8% of BC leg.
Like other harmonic patterns, the Gartley pattern has both bullish and bearish modes. It is also used as a market reversal signal. To get a buy position, we should wait for bearish strength and identify piece patterns to get the correct entry. Similarly, in a bullish market, we should identify these as a potential sell signal.
How to Trade Harmonic Pattern?
You can use the harmonic pattern as an individual trading strategy, or use your trading strategy to increase the probability. Some traders struggle to identify the possible market reversal zone. Therefore this tool is handy to say where the market is going to reverse. However, we can use this tool as an individual trading strategy, as mentioned below:
#1 Bullish Harmonic Pattern Trading Strategy
To enter a buy position, you should identify a sell trend.
- Read the market carefully and identify how it is coming from the starting point to the ending point of the harmonic pattern.
- Enter the trade as soon as the model completes it. in the market condition, enter the market after a bearish rejection.
- Stop-loss should be below point X with some buffer.
- Take profit should be at the level of A.
#2 Bearish Harmonic Pattern Trading Strategy
To enter a sell position, you should identify a buy trend.
- Read the market carefully and identify how it is coming from the starting point to the ending point of the harmonic pattern.
- Enter the trade as soon as the model completes it. in the market condition, enter the market after a bearish rejection.
- Stop-loss should be below point X with some buffer.
- Take profit should be at the level of A.
Conclusion
Trading strategy in the financial market that can guarantee a hundred percent profit. In some market conditions, some reasons are unavailable.
Market volatility might eat your stop loss and then move the price in your desired direction. you should follow a reliable risk management tool and be active with price action to avoid uncertain market conditions.
Recent Trade Idea You May Follow
Share on facebook
Share on twitter
Share on linkedin


