
Forex trading is an extensive source of earning money from home. The involvement of retail traders has been increased dramatically after the financial crisis of the early of the century. The forex market is moved by the big players and institutions. The involvement of retail traders is very small in setting the price direction.
Most of the price direction and settlement happen over the counter market. Therefore, the price comes to the retail trader through the retail forex trading broker.
To be successful in the industry traders the main intention should follow what the big players are doing in the market. The technical analysis is the tool to determine what the big players and market movers are doing in the market. The importance of technical analysis can be described by saying that if a trader doesn’t know about macro or microeconomics can still make money just by following technical analysis rules. It consists of several tools that help to predict the market, RSI is one of them.
What is RSI in Forex?
The RSI in Forex is a technical analysis indicator or tool that comes from the oscillator family that can maximize your profit. This trading indicator is a leading indicator that provides signals on the chart. The positive characteristic of this indicator is that it can eliminate early signals for trades. However, the demerit is that many signals can appear to be false.
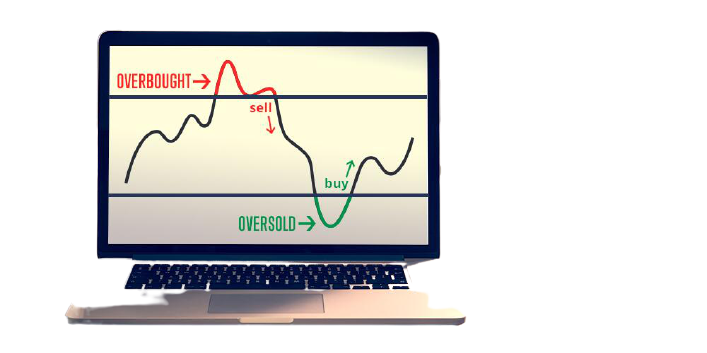
The RSI indicator consists of a single line that moves up and down between 0-100 zones. The area is divided into three zones:
- Oversold Area: 0-30 levels
- Neutral Area: 30-70 levels
- Overbought Area: 70-100 levels
The RSI line moves within these three areas and creates different trading signals.
The default RSI is typically 14 periods. Let’s see the RSI calculation in detail:
First, let’s see the RSI formula with the 14-period setting:
RSI = (100 – (100 / (1 + RS)))
**RS= stands for Relative Strength.
This calculation is simple and straightforward. However, we need to calculate the value of the RS. We can find it from this calculation:
RS = (14 EMA on the last 14 up bars) / (14 EMA on the last 14 down bars)
After calculating the value of RS. We can put it on the value of RSI to find the ultimate value.
So, the RSI should be used with a combination of other forex trading tools to increase the probability. In the following section, we will discuss the RSI indicator and how we can use it in the fx strategy.

RSI Trading Approach
We will now transfer gears and talk about some method constructing trading strategy with the RSI. We will use the trading indicator as mentioned above to set access and go out factors on the trading chart and the usage of the basic rules of RSI.
RSI Trading Entry & Stop Loss
- To enter an RSI exchange, you look for a sign from the RSI. It could be both oversold or overbought RSI or an RSI divergence sample.
- In case you want to trade based on the divergence with RSI and price, you then might input an exchange in the direction set by the price action and RSI, after closing two or three candles in a row towards the direction of the trend.
- Overbought Area: 70-100 levels
As we cited in advance, the RSI indicator might provide ineffective signals if used as an only indicator. Even if you combine other trading signals, it’s far necessary to use a stop loss to fight with the unavoidable risks.
The surest area to prevent loss that is passed a current swing high or low, created on the reversal time.
RSI Take-profit
The simple RSI indicator that is in the chart in which you have to keep your change till getting a contrary sign from the RSI. Again, this may move to the top or bottom based trading opportunity, in addition to bullish or bearish divergence with the price and RSI. However, within the practical market condition, it is logical to take partial or complete profits out in advance the usage of different price action primarily based policies or use a trailing stop loss method.
RSI Divergence
RSI Divergence is the ultimate sign we are able to discuss. As with a few different signs, such as MACD and Stochastics, the Relative power Index Indicator can diverge from the overall price action that may provide clues into ability reversals in the marketplace.
- Bearish RSI Divergence – charge action is growing, at the same time as the RSI line is decreasing; that is a strong bearish signal on the chart.
- Bullish RSI Divergence – price motion is reducing while the RSI line is growing; that is a sturdy bullish sign on the chart.

RSI Oversold Circumstance
The oversold RSI sign seems whilst the RSI line enters the 30-zero location. while the RSI is oversold, it means that the charge is possible to grow.
RSI Overbought Situation
The first signal we will talk about is the overbought signal. The RSI Indicator offers a sign for an overbought condition while the RSI line enters the 70-100 vicinity.
Final Thought
The forex market is very uncertain with a lot of volatility for retail traders. Therefore, it is recommended for traders to use an appropriate trade management system in every trading strategy. Traders should minimize the risk when the market is uncertain and take the maximum benefit from the market when the market is moving within the desired direction.
Money management is an important part of a forex trading strategy. Every trader should use the appropriate money management tools that match his/her personality. It is not recommended to risk 100$ for the return of $50.
Explore 21 Advanced Forex Trading Strategies
Recent Trade Idea You May Follow
Share on facebook
Share on twitter
Share on linkedin


