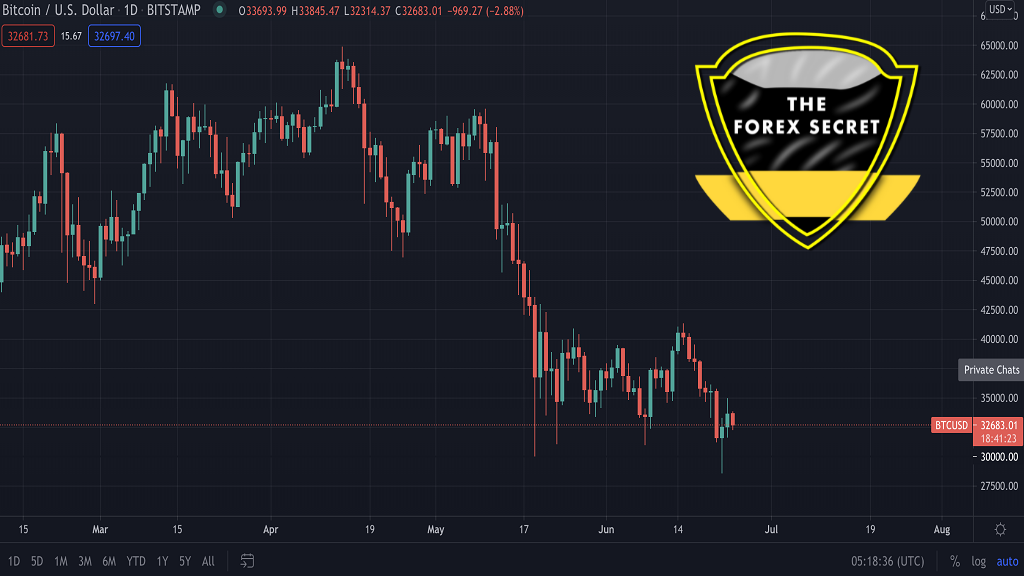
June 24, 2021|The Forex Secret –Bitcoin is the world’s most traded cryptocurrency that was under pressure as soon as China banned crypto mining and provided a tension of electricity usage by crypto miners. As a result, the price moved down with an impulsive bearish pressure but the recent crypto adoption by El Salvato created hope for buyers.
Bitcoin Daily Chart
Based on the daily chart, the price moved down to the $30,000 level with an impulsive bearish pressure but failed to hold a daily candle below it. Moreover, this week’s price rejected the $30,000 level with a bullish daily close that created a bullish possibility in the price.
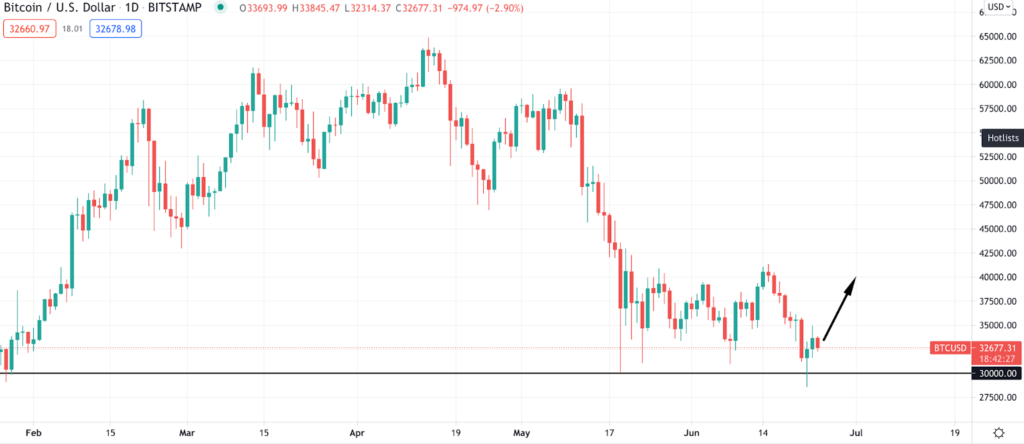
Based on the above image, Bitcoin’s price is trading above the $30,000 level but still below the dynamic level of 20 EMA. As long as the price is trading above the $30,000 level we can expect another surge to $40,000 level. Only a strong bearish daily close below the $30,000 level can take the price lower.
Bitcoin H4 Chart
Based on the H4 chart the price is trading below the Ichimoku Kumo Cloud where a stable position above the Kumo resistance is required to consider it as a bullish trend.
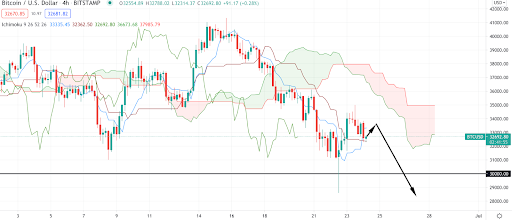
On the other hand, any rejection from the Cloud resistance with a bearish H4 close below the Kijun Sen may continue the bearish movement.
Is Bitcoin A Buy?
Based on our findings, the last hope for Bitcoin bulls is the $30,000 level. If the price stayed above this level in the next 2-3 days it may surge higher in the coming days.
Recent Trade Idea You May Follow
Share on facebook
Share on twitter
Share on linkedin


